NABA Posters
Data as a design language.
00

Problem
Institutional data is rarely engaging, numbers without context, statistics without soul. NABA needed a way to communicate its identity, values, and community not through dry reports, but through something students and prospects could actually feel connected to.
Solution
A series of thematic data visualization posters that transform quantitative data into visual storytelling. Built on a unified aesthetic language of constellations, orbital trajectories, and gradient palettes, each poster functions as a standalone data portrait, and as part of a broader visual ecosystem that narrates NABA's world.
This project explores the boundary between information design and editorial art. Rather than displaying numbers, each poster translates them into meaning, reflecting NABA's core values of quality, evolution, and the centrality of its student community. Designed by students of the Master in UX/UI, the series itself stands as tangible proof of the program's quality.
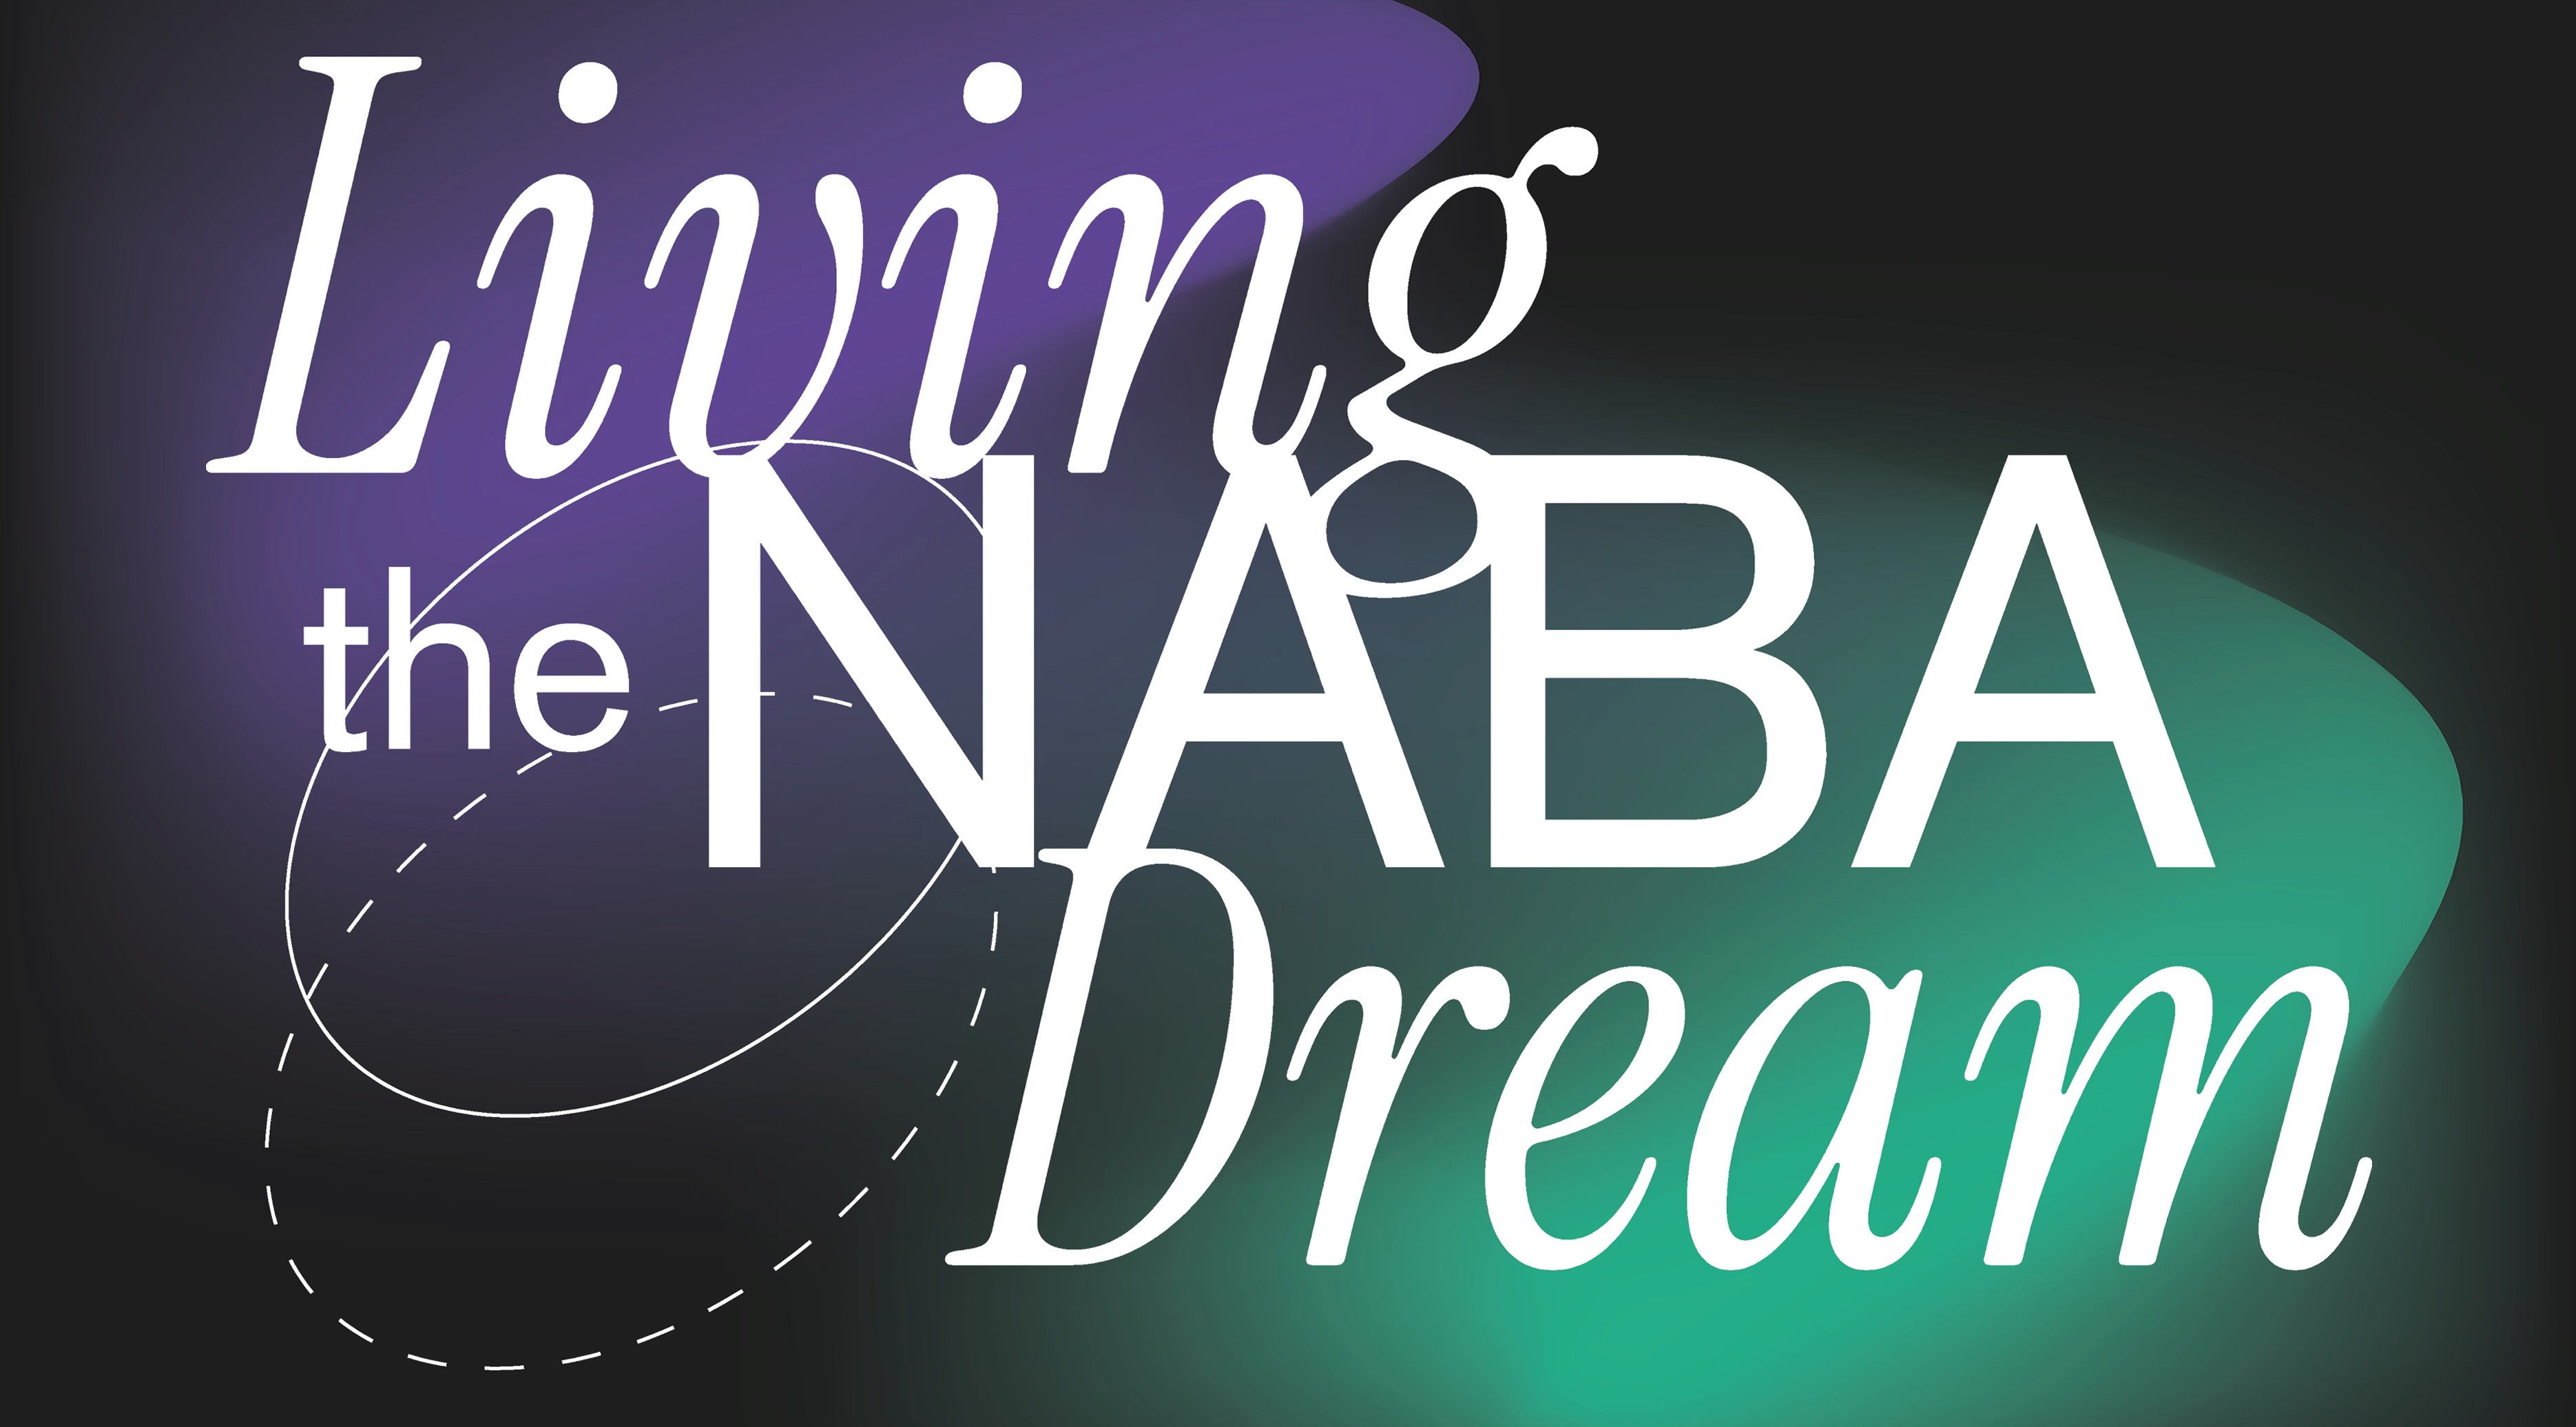
The process began with Living the NABA Dream, the campaign manifesto and the conceptual entry point to the entire series. Rather than leading with complex infographics, it centers on the "why": presenting the NABA experience as a journey built on four pillars, Mission, Journey, Project, and Output, and guiding the viewer toward the Open Day.
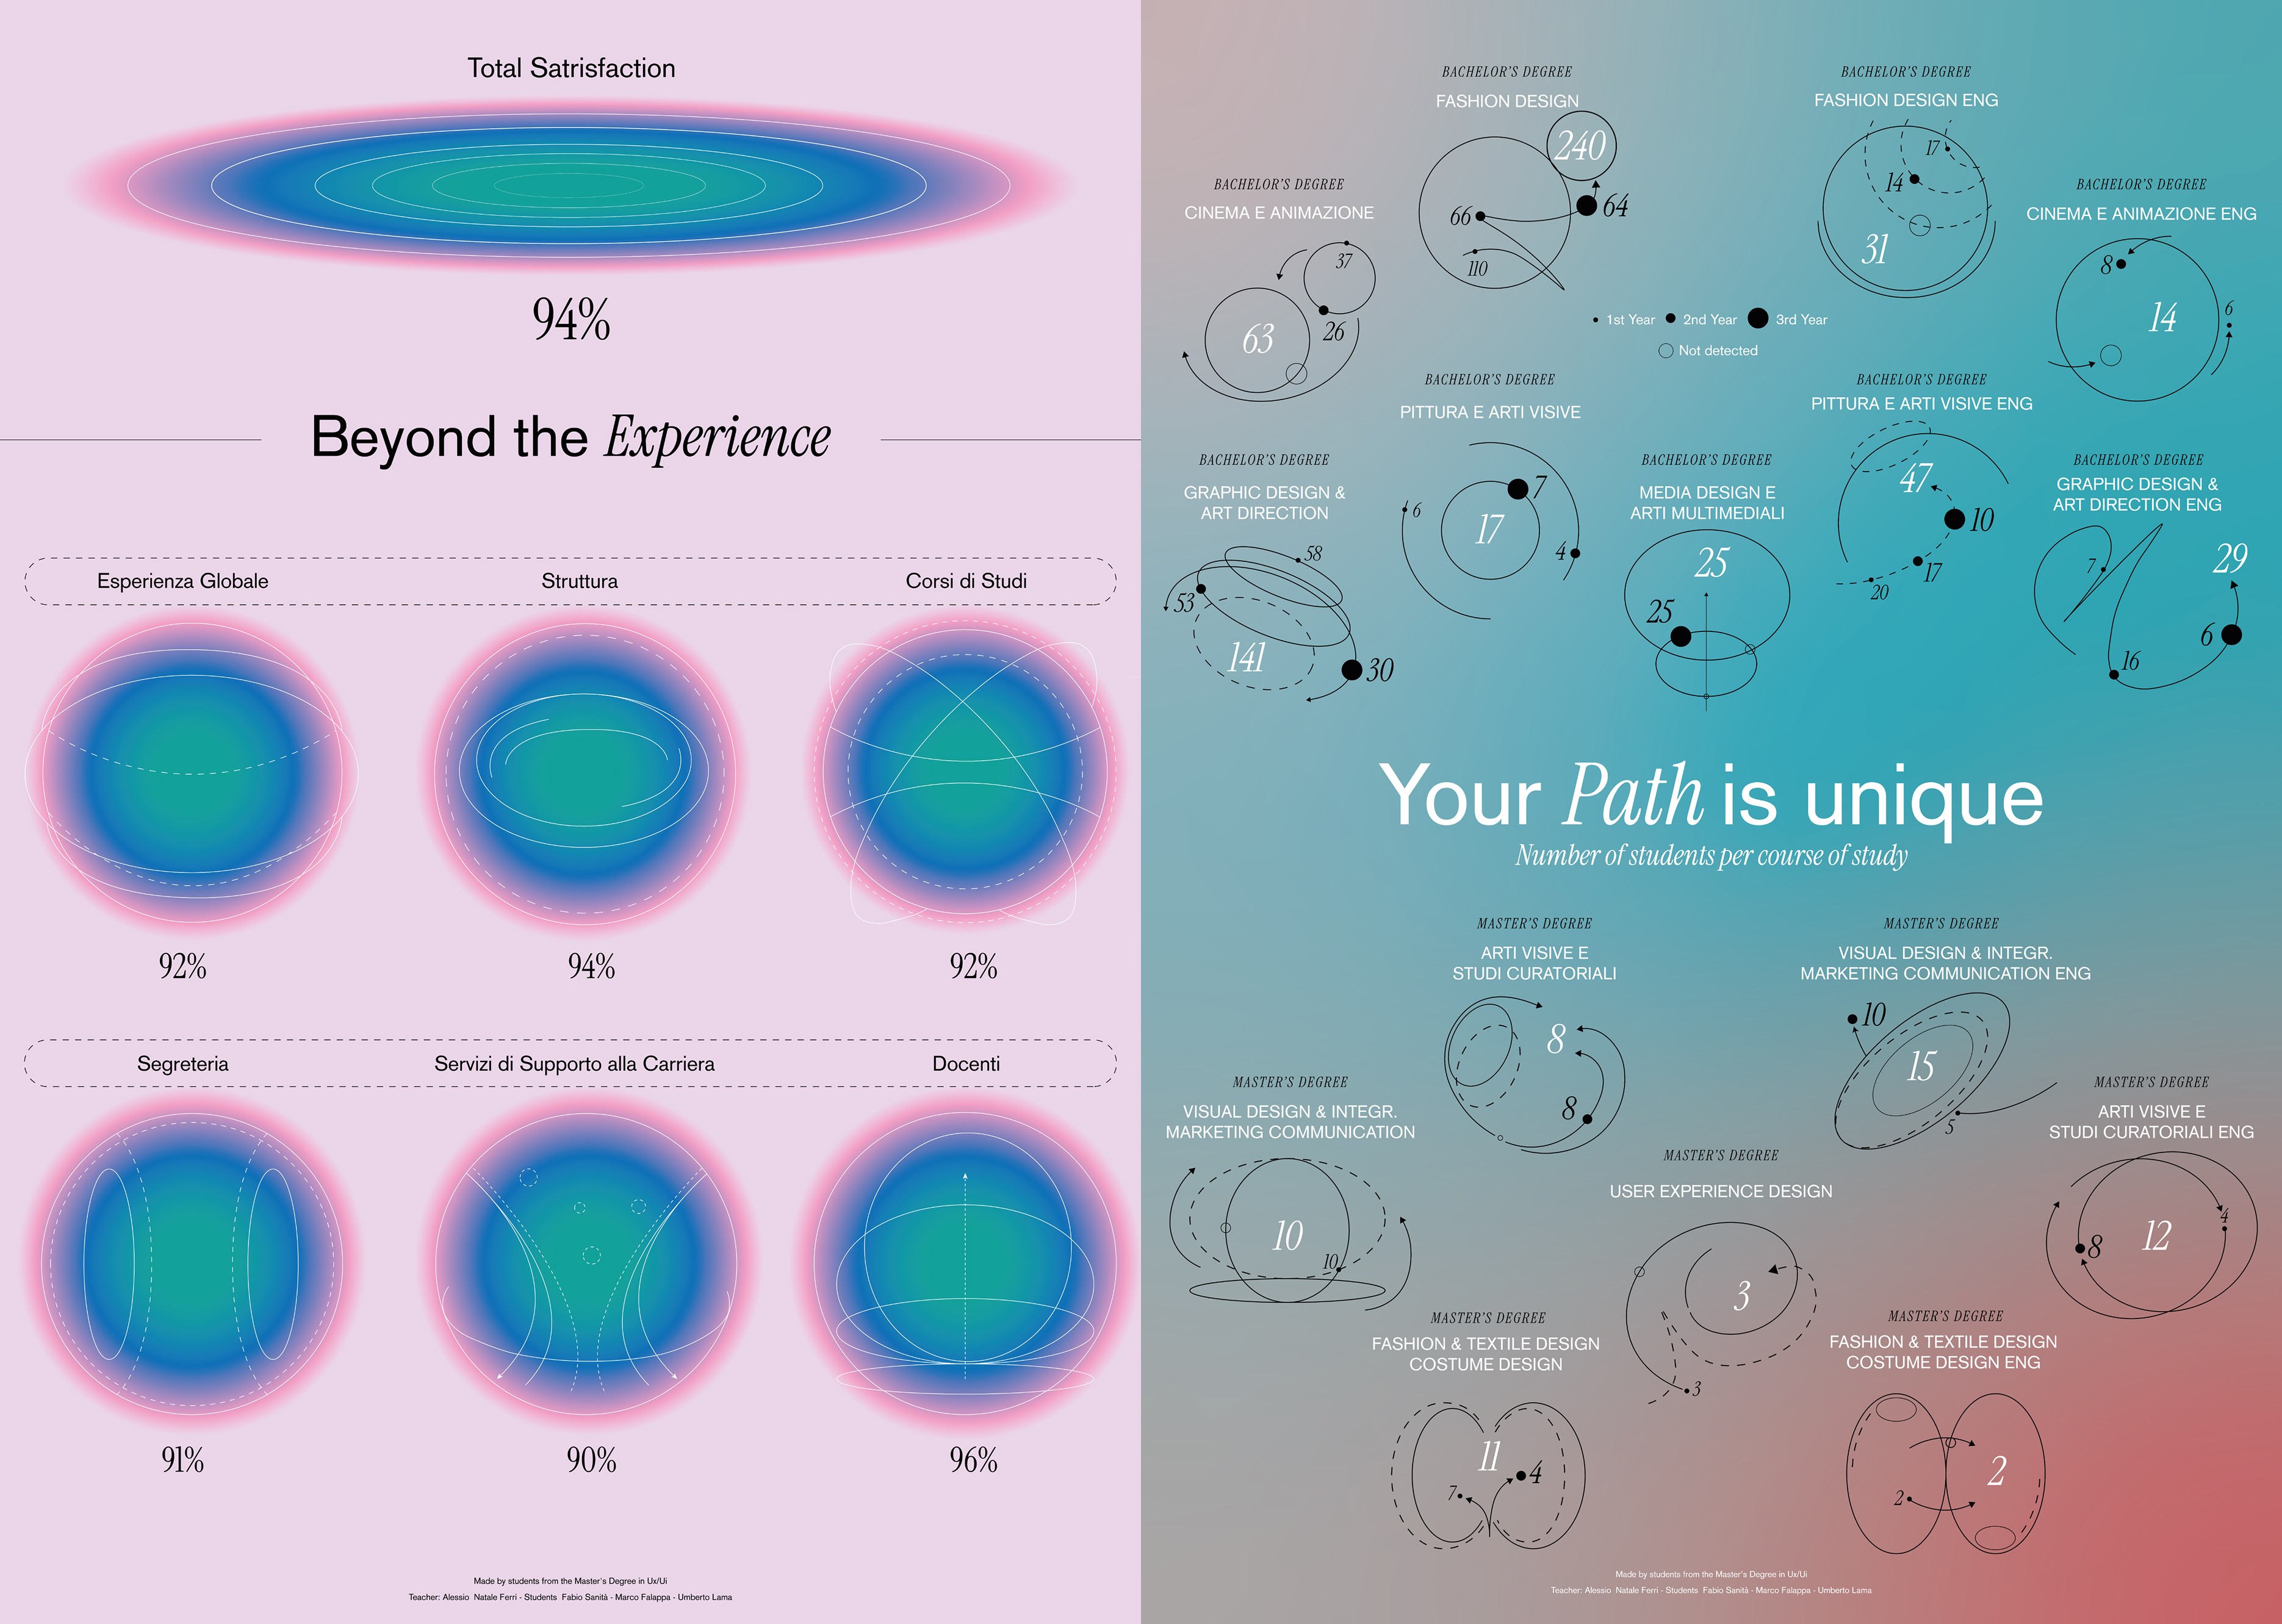
The remaining posters each tackle a specific theme through a distinct visual approach. Feel the Connection maps the geographic origins of NABA's international student body as an orbital diagram. Asset Matters visualizes resource distribution across analogue and digital tools. Your Path is Unique traces academic trajectories through constellation-like forms. Beyond the Experience renders satisfaction data as glowing, layered spheres, almost emotional in their softness.
The aesthetic system, vibrant gradient palettes, circular data forms, and a consistent typographic mix of serif and sans-serif, was designed to work at every scale, from a printed A1 poster to a digital campaign asset.
year
2024
timeframe
3 months
tools
Illustrator
category
Data Visualization
01
02

03

04

05


